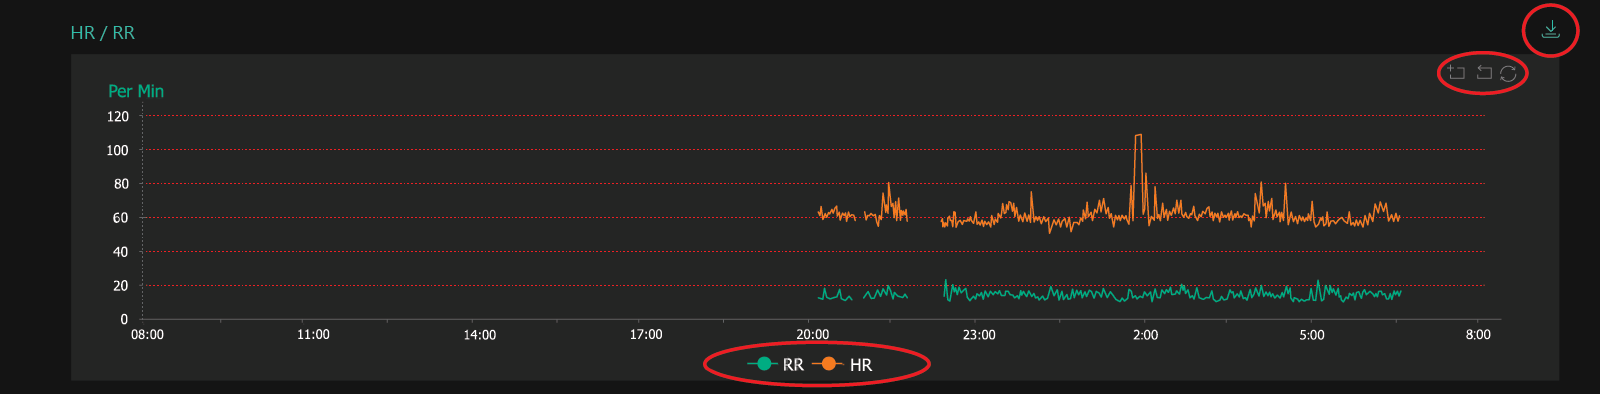
Displays the heart and respiratory rate of the Client for the 24 hour time frame selected.
By clicking on the legend colours for RR and HR (circled) each can be switched on or off to simplify the graph.
Hovering with the cursor anywhere on the graph will display the heart rate and respiratory rate for a specific time and date.
In the top right-hand corner of the graph there is also a Zoom In tool icon which allows the user to zoom into a specific area of the chart. Click on the Zoom In tool icon and then click and drag with the cursor on the area of interest.
To move back one step, click the Zoom Back tool icon.
To restore the normal view, click on the restore icon.
At the top right is this download icon. Click it for a printable PDF copy of this report.